India’s water, on the record.
We join the reservoir bulletins, groundwater assessments, pollution samples, court filings and satellite images that already exist into one dated record. Then we read what is on the ground today.
Built for companies checking a site, funders restoring lakes and tanks, and departments watching rivers, canals and flood-prone streets.
14 Oct 2026 · 4,489 of 13,222 Mcft
CMWSSB daily lake levels · Chennai dashboard
The record is free. The answer for your place is the work.
Everything on neervazhvu.org stays open. When you need a decision about a place of your own, this is what changes.
| What | The open record, free | Working with us |
|---|---|---|
| Where | The cities and districts on the site | Any site, tank, lake, river or district you name |
| What you get | Maps and dashboards of public data | A written answer to your question: is this site’s water secure, which tanks to restore first, did the restoration hold water |
| Imagery | Free satellite images | Adds high-resolution imagery that cannot be published openly |
| Over time | Updated when public sources update | Your places re-read every season, with a flag when something changes |
| Who sees it | Everyone | Only you |
| Format | Web pages | Reports and editable decks for your board, material for BRSR and CDP disclosures, data files for your systems |
| Checks | Every source cited | Every number re-derived by an independent check before it reaches you |
The registry: one shape for every water dataset.
India has the water data, scattered across district PDFs, state dashboards, court filings and satellite archives, each with its own names, units and dates. Our data model gives every dataset the same shape: the place it describes, who published it, under what licence, how it was made and when.
The registry holds 2,180 files today. 2,060 carry their source, licence, date and method, and 438 are checked field by field against a published dataset contract. They cover the 10 cities and 17 districts live on the site, across 53 registered places, and we watch 185 upstream sources for a new edition.
The registry as a service
- Bring your own water data: a utility’s meters, a programme’s works, a research group’s samples. We put each dataset into the standard with its source, licence, date and method attached.
- We join it to the places it describes, with the official codes for wards, villages, blocks, districts and basins.
- Every file is checked against the standard, and you get a conformance level you can show a funder or an auditor.
- We watch your sources, flag a new edition when it lands, and give every release a version number.
- The data model is an open standard under CC BY 4.0, so your data is never locked to us.
Four layers, each built on the one below.
- 1
The registry
Every source joined into one standard shape, released in public with a version number. We watch each source and flag a new edition when it lands.
- 2
Readings
What is there today: reservoir storage and days of supply, groundwater stress by block, river quality, flood extents, shoreline change, and how often each part of a tank bed holds water. Each reading says whether it comes from a gauge, a bulletin or a satellite. Tank readings are in pilot.
- 3
Ledgers
Who promised what, and what happened since: water allocations, public commitments and restoration works, set against the readings.
- 4
Briefings
Plain-language summaries of what changed, in English and regional languages.
Use cases.
Questions people brought us, what we did, and what came out. Published work opens on this site. For commissioned work, here is what we found. We do not name the people we work for.
Published
 Kolar district, Karnataka
Is this factory’s water secure?
A site water reading for a food factory: the groundwater status of its taluk, the tanks around it and the rules on drawing groundwater. The district view it rests on is open.
In July 2026 the 42 registered tanks around the site held 21 ha of water, 4% of their 486 ha and the second-lowest July since 2020.
Open the Kolar atlas → Chennai’s coast, Tamil Nadu
What does this canal look like today, kilometre by kilometre?
A baseline of the Buckingham Canal from Ennore to Mahabalipuram: its course, the width of open water every fifty metres, and how its banks have changed.
Open the canal → Erode district, Tamil Nadu
What runs through this district’s rivers, and who draws on them?
A district river atlas joining rivers, canals, reservoirs, groundwater, sewage outfalls and industry, down to each village panchayat.
Open the Erode map → Mumbai, Maharashtra
Can a city’s rivers, lakes and supply lakes sit on one map?
A rivers-and-lakes atlas for Mumbai, built with a local partner: river catchments, the seven supply lakes, polluted stretches, flood spots and treatment plants.
Open the Mumbai map →
Commissioned
- 180lakes read from satellite, monsoon 2026Greater Bengaluru
Which lakes should restoration money go to next?
Of the 210 lakes on Greater Bengaluru’s custody lists, 180 were read the same way and placed in classes a funder can act on: 23 need attention, 15 are ready to co-fund and 44 need design first. The next edition follows in November 2026.
Custody lists of Greater Bengaluru’s lake agencies; Sentinel-2, 28 March 2017 to 30 August 2026 - 35–38 haof water at Jakkur every year, 2012–2021Jakkur and Kaikondrahalli lakes, Bengaluru
Did the restoration hold water?
Before its 2008–12 works Jakkur held 15 to 38 ha of water a year; since, 35 to 38 ha every year. Kaikondrahalli never held more than 8 ha before 2010 and has held 7 to 11 ha every year since its restoration. Every year from 2018 to 2026, a typical clear image showed signs of algae across the open water of all three lakes we read.
EC JRC Global Surface Water (Landsat), 1988–2021; Sentinel-2, 2017 to October 2026 - 211.8%of its sustainable groundwater drawn by the block, 2024–25Alwar district, Rajasthan
How much groundwater is left under this industrial area?
All 14 of Alwar’s blocks are over-exploited in every assessment from 2021–22 to 2024–25, and the district draws 182.1% of what can be drawn sustainably. The block holding an industrial area near Alwar city draws 211.8%.
IN-GRES groundwater assessments, 2021–22 to 2024–25 - 3 drain statesworking, half-blocked and blocked, in a storm like 5 September 2022HSR Layout, Bengaluru
Which streets flood, and how much do blocked drains add?
A street-scale model of one neighbourhood’s low ground and drains shows standing water spreading further at every step from working to blocked drains. We map where water spreads, never how deep it stands.
Terrain, drain and rainfall scenarios for HSR Layout
Tanks as they are today.
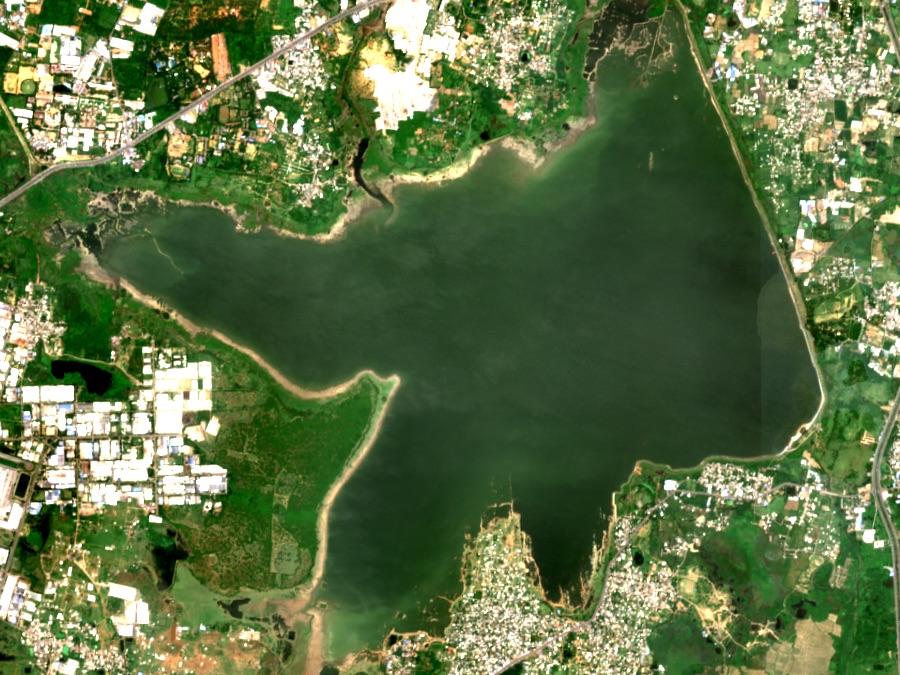
A tank register records each tank as it was designed: its full level, its spread, its capacity. Satellites show how it fills now. For Vandiyur we read 172 months of Landsat from Dec 1992 and 292 radar scenes from 2017 to 2026, and mapped how often each part of the bed holds water. The same method has run on four more tanks in Tamil Nadu and Karnataka.
It shows where a tank holds water and how often. Turning that into a volume needs one surveyed water level, which is the next step. Pilot work, not yet on the open maps.
We never correct an agency’s figure. We put a dated reading beside it.
- Every number shows its source and its date. Older figures are labelled as history, not as today.
- We check a source’s licence before we use it, and say so when a source states none.
- A satellite reading says what it cannot see, and every classification goes through manual review.
- We do not rank, score or grade the people who run India’s water.
- The code is open under the MIT licence, and the method is written down.
Tell us a place.
We’ll tell you where its water stands.
- The place: a name, an address or coordinates.
- The decision it supports.
- When you need it.
We reply with what the record already holds for that place, and what a reading would add.
Readings on this page: CMWSSB daily lake levels (Chennai); Tamil Nadu reservoir dashboard (TN-SMART, RIMES) and TNGIS (Kelavarapalli); TNPCB reports of analysis filed before the NGT Southern Zone in O.A. 111 of 2020 and O.A. 14 of 2025 (Chokkarasanapalli); EC JRC Global Surface Water and Copernicus Sentinel-1 (Vandiyur); Contains modified Copernicus Sentinel data 2026 (Chembarambakkam image). Registry figures from the NVDM conformance report. The code is on GitHub under the MIT licence, and each dataset keeps its publisher’s licence.